What is the Result Section of a Research Paper?
The results section of a research paper is a critical component that presents the key findings derived from the study. It serves as a factual and objective account of the data collected during the research process.
The purpose of the results section is for researchers to report their observations and measurements of the hypothesis. This is achieved by utilizing tables, graphs, or statistical measures to convey the information effectively.
What Does the Results Section of a Research Paper Include?
In the results section, you show off what you found in your research. Here's a quick look at what it includes:
- Data Presentation: Display your information using figures and tables.
- Descriptive Statistics: Use numbers like average and middle values to summarize your data.
- What It Means: Explain what your results say and if there are any patterns.
- Correlations and Relationships: Look for a correlation between two variables or different factors and talk about them.
- Limitations: Mention any problems or limits your study might have.
- Compare with Others: See how your findings relate to what others have discovered before.
How To Write Results in A Research Paper Step-by-Step
Writing a clear and concise results section is key to any research paper. Here's how you can present your findings effectively:
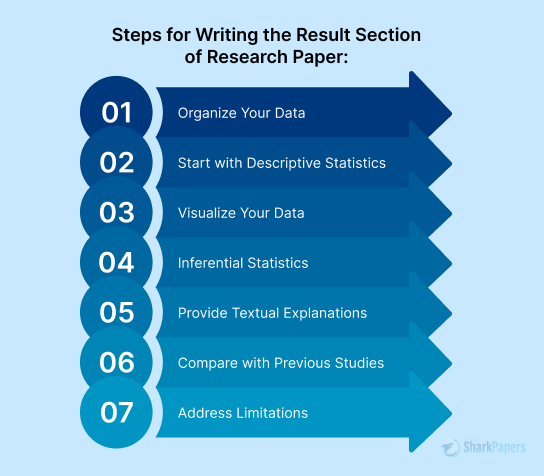
Step 1: Organize Your Data
Organizing your data is a critical first step in the Results section of a research paper. This involves structuring your raw data in a way that is clear, logical, and easily digestible for your readers.
- Raw Data Arrangement: Group similar data logically, such as by time or experimental conditions.
- Visual Representation: Use tables, graphs, or charts for clarity; pick the format that suits your data best.
- Clarity in Design: Ensure visuals are clear with labels, colors, and consistent formatting.
- Quick Understanding: Aim for simplicity; make sure readers can grasp the main points at a glance.
- Consistency: Keep a consistent writing style across visuals for a cohesive presentation.
Step 2: Start With Descriptive Statistics
In this section, dive into the specifics of your data through systematic description, providing a snapshot that captures both central tendencies and variability.
- Calculate the Mean: Find the average value of your data points, offering a central measure indicative of the overall trend.
- Explore the Median: Identify the middle point of your data, a robust measure that remains unaffected by extreme values.
- Assess Standard Deviation: Understand the dispersion of your data around the mean, highlighting the degree of variability.
Step 3: Visualize Your Data
Enhance understanding by incorporating visual representations. Graphs and charts can convey trends and patterns effectively, providing readers with a more intuitive grasp of your results.
- Select Appropriate Visuals: Choose the right type of graph or chart based on your data—bar charts for comparisons, line graphs for trends, and pie charts for proportions.
- Ensure Clarity: Design visuals with clear labels, legible fonts, and distinctive colors to facilitate easy interpretation.
- Highlight Trends: Emphasize significant trends or patterns in your data, guiding readers to key insights.
Step 4: Inferential Statistics
If applicable, apply inferential statistics to analyze the significance of your findings. Use tests to show statistically meaningful positive and negative results.
- Select Relevant Tests: Choose appropriate statistical tests based on your research question—ANOVA for multiple groups, t-tests for two groups, etc.
- Establish Significance Levels: Define significance levels (usually p-values) to determine whether observed differences are likely due to chance.
Step 5: Provide Textual Explanations
Accompany visual elements with clear and concise textual explanations. Explain the significance of observed trends or patterns in your visuals, ensuring readers grasp their relevance to your research problem.
Acknowledge and explain any unexpected results, offering insights into potential factors or nuances that may have influenced the outcomes.
Always tie your explanations back to your research question, emphasizing how each finding contributes to the broader understanding of the results of your study.
Step 6: Compare with Previous Studies
By discussing similarities, differences, or advancements in knowledge, you can highlight the uniqueness of your contribution to the field.
Summarize relevant findings from the literature review and review articles related to your research question. Compare or contrast your results with those of previous studies. Discuss similarities and differences, emphasizing the novel aspects of your research.
In the end, identify any contributions your study makes to advancing knowledge in the field. Highlight how your findings build upon or challenge existing understandings.
Step 7: Address Limitations
Acknowledge and address any limitations in your study. Discuss how these limitations may have influenced your results, maintaining transparency about the potential impact on the study's outcomes.
Lastly, propose avenues for future research that could address the identified limitations, offering insights for researchers interested in building upon your study.
By following these steps, you can engage your audience, providing a comprehensive and insightful view of your research findings.
Difference Between Data, Results, and Discussion in Research
The data you collect and use for research, the results section, and the discussion, all work together for a polished final research paper. Let’s briefly discuss the differences between them.
The results section presents the data without much interpretation or context. It's focused on showing the findings, such as numbers or trends, without making broader connections. Though interpretation is minimal, it’s still necessary to highlight the relevance of the data.
The discussion section, on the other hand, allows for more interpretation and explanation. Authors compare their data with previous research, suggest possible explanations for their findings, make generalizations, and propose future research directions. This section allows for comprehensive analysis and speculation beyond the raw data presented in the results.
Results Section for Quantitative Research
When crafting the Results section for quantitative research, there are several key qualities that can enhance the clarity, validity, and overall impact of your presentation.
Here are the main qualities to consider for crafting a results section for quantitative research:
- Comprehensive Descriptions: Clearly state what each statistical test or measure represents and how it contributes to your study.
- Appropriate Visual Elements: Ensure that these visuals are accurately labeled, easy to interpret, and directly support the points made in the text.
- Inclusion of Key Statistical Measures: Include essential statistical measures relevant to your study, such as means, standard deviations, p-values, confidence intervals, and effect sizes.
- Concise Interpretation: Highlight the most salient patterns or trends and their implications. Save in-depth interpretation and discussion for the dedicated Discussion section.
Here is an example of the quantitative results of a research paper:
Results Section for Qualitative Research
Writing the Results section for qualitative research involves presenting and interpreting the data collected through methods such as interviews, observations, or content analysis.
Here are the main qualities of a results section of qualitative research:
- Participant Voice: Prioritize the voices of the participants. Include direct quotes to give the participants a presence in the Results section.
- Negotiation of Bias: Acknowledge and discuss the potential biases and subjectivities that may have influenced the interpretation of the data.
- Negative Instances: Discuss instances where the data deviate from the identified themes and explore the reasons behind these variations.
- Comparison and Contrast: If applicable, compare and contrast themes across different participant groups, contexts, or time points. This adds depth to the analysis and helps in identifying patterns or variations within the data.
- Transition to Discussion: Conclude the Results section with a seamless transition to the Discussion section. Briefly summarize the main findings and indicate how they will be further explored and interpreted in the subsequent section.
Here is an example of the qualitative results of a research paper:
Results Section Examples
Here are some examples for learning how to write the results section of a research paper.
Mistakes to Avoid When Writing Results Section of Research Paper
Understanding the Results section of a research paper needs carefulness and attention to detail. To present your findings well, avoid these common mistakes:
Mistakes to Avoid | Writing Tips to Improve |
Excessive Detail | Focus on key findings; use appendices for extensive data. |
Repetition of Data | Complement visuals with interpretations and context in the text. |
Interpreting Before Describing | Ensure a structured approach: describe data first, then interpret. |
Ignoring Outliers or Anomalies | Acknowledge anomalies and discuss potential reasons behind them. |
Misuse of Statistical Jargon | Simplify statistical terms; provide clear explanations. |
Lack of Clarity in Visuals | Design visuals with simplicity, clarity, and appropriate labeling. |
Neglecting the Research Question | Constantly reference back to the research question for focus. |
Omitting Limitations | Be transparent about limitations and discuss their potential impact. |
Exaggerating Significance | Stick to a balanced and honest representation of findings. |
Neglecting Future Directions | Conclude by outlining potential directions for further investigation. |
Wrapping up, getting the hang of the results section demands precision and clarity. By preventing common mistakes, you enhance the credibility of your findings.
Keep it simple, stay focused on your main question, be transparent about limitations, and write the results section in an unbiased manner.
But still, if you think this work is too much for you and are wondering which paper writing service for me is the best, turn to SharkPapers.com.
We are experts who can craft an outstanding research paper as well as different sections of your research paper.
Visit our platform and buy research papers without breaking the bank!



)





-12114.jpg)


 Not seeing it? Check Promotions or Spam — inboxes get protective.